
Project, line items and documents
The project breaks down into chapters, line items and sub-items, and each job is a document with its owner. The Gantt chart also shows documents that do not belong to any project.
Choose which cookies you accept. You can change this at any time from “Cookie settings” in the footer of every page. Cookie policy
They make the website work, remember this choice, keep your conversation with the assistant if you use it, and protect the forms from bots. They cannot be turned off.
During your visit we remember the campaign source you arrived with and the page you landed on, so we know which campaigns and pages bring us requests. Cloudflare Web Analytics counts visits without cookies and does not depend on this option.
Used to measure our campaigns on Google Ads, LinkedIn and Meta. None is active on the website today.
Gantt chart
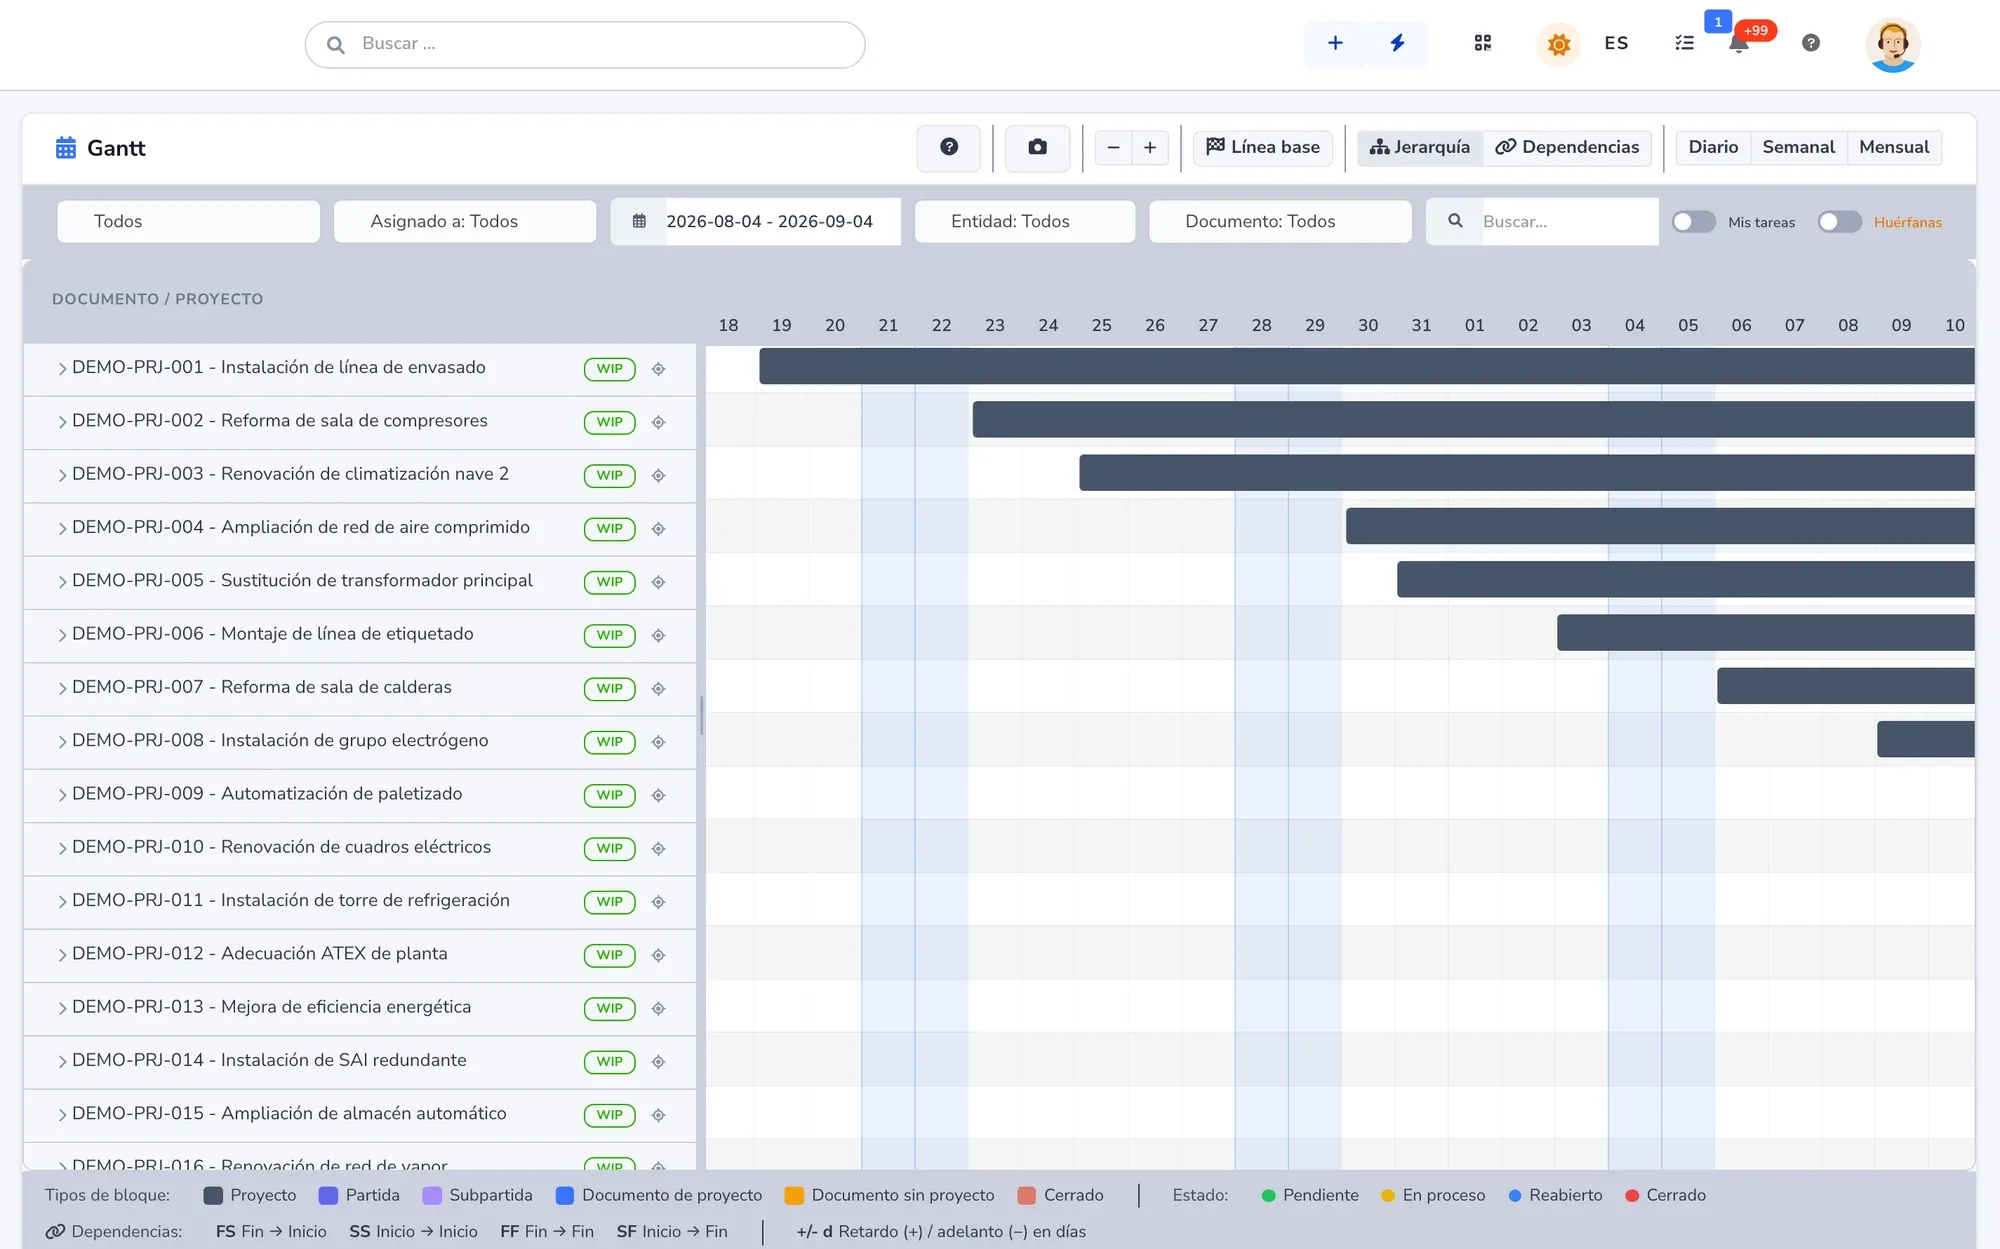
Projects, construction jobs and plant shutdowns on a Gantt chart with line items, dependencies and a baseline. Progress comes from the documents your technicians close, and cost adds up as the work gets done.
Work and planning
The project breaks down into chapters, line items and sub-items, and each job is a document with its owner. The Gantt chart also shows documents that do not belong to any project.
Finish-to-start, start-to-start, finish-to-finish or start-to-finish, with lag or lead in days. The sequence is written into the plan, not kept in the site manager’s head.
You save a snapshot of the approved plan. Then you compare planned against actual and see where the job has drifted, before the customer asks you.
Progress comes from closed documents against the totals. Hours by rate, expenses and materials add up live, so you know the margin without waiting for month-end close.
The workload report shows who is overloaded before you commit to a date. It is calculated on each person’s real working hours, with their holidays and absences.
Import the estimate from Presto or Arquimedes in BC3 format. Chapters, line items and amounts arrive without retyping, ready to plan with estimated hours.
How it works
By hand or from a BC3 file, with its chapters and line items.
Set dates and estimated hours, link the dependencies and assign each job. View it by day, week or month.
Once the plan is approved, you save the snapshot you will compare against.
Technicians close their documents, and the project’s progress and cost update.
Where it is used
Industry solutions
Use cases by department
Honesty
It is not used on mobile. The Gantt chart is a desktop screen: the plan is adjusted in the office and technicians work their documents from their phones.
If your BC3 file has many levels, part of the hierarchy is flattened on import. Check the structure before planning.
Works with
The team’s schedule, based on each person’s real working hours
See Scheduling and calendarTasks inside the document or standalone, with a date and an owner
See attendo TasksBoards by status for any document type
See KanbanGlossary
Projects
Project timeline · schedule chart
A Gantt chart is a project schedule drawn as bars: each task takes one row, and its bar starts and ends on its planned dates.
Projects
Project baseline · schedule baseline
A baseline is the saved copy of a project’s approved plan, with its dates and durations. It lets you compare what was planned with what is actually happening at any time.
Projects
Finish-to-start · predecessors
Task dependencies are the rules that tie the start or finish of one task to another, such as painting not starting until the plaster has dried.
Projects
Team workload · utilization rate
Resource utilization is the share of each person’s available hours that is already committed to planned work, measured by day, week or month.
Frequently asked questions
No. It works for a plant shutdown, a store opening or an installation. It also schedules standalone documents that do not belong to any project.
The four classic ones: finish-to-start, start-to-start, finish-to-finish and start-to-finish. Each one supports lag or lead in days.
Yes, if it exports to BC3, like Presto or Arquimedes. Chapters, line items and amounts come across.
Yes. The Gantt chart reads the same business calendar as deadlines and the agenda. And workload is measured against each person’s real hours.
Request a demo
We will show it to you with your own document types and the way you work. If it is not a fit, we will tell you.
Would you rather talk first?