
Reports for every area
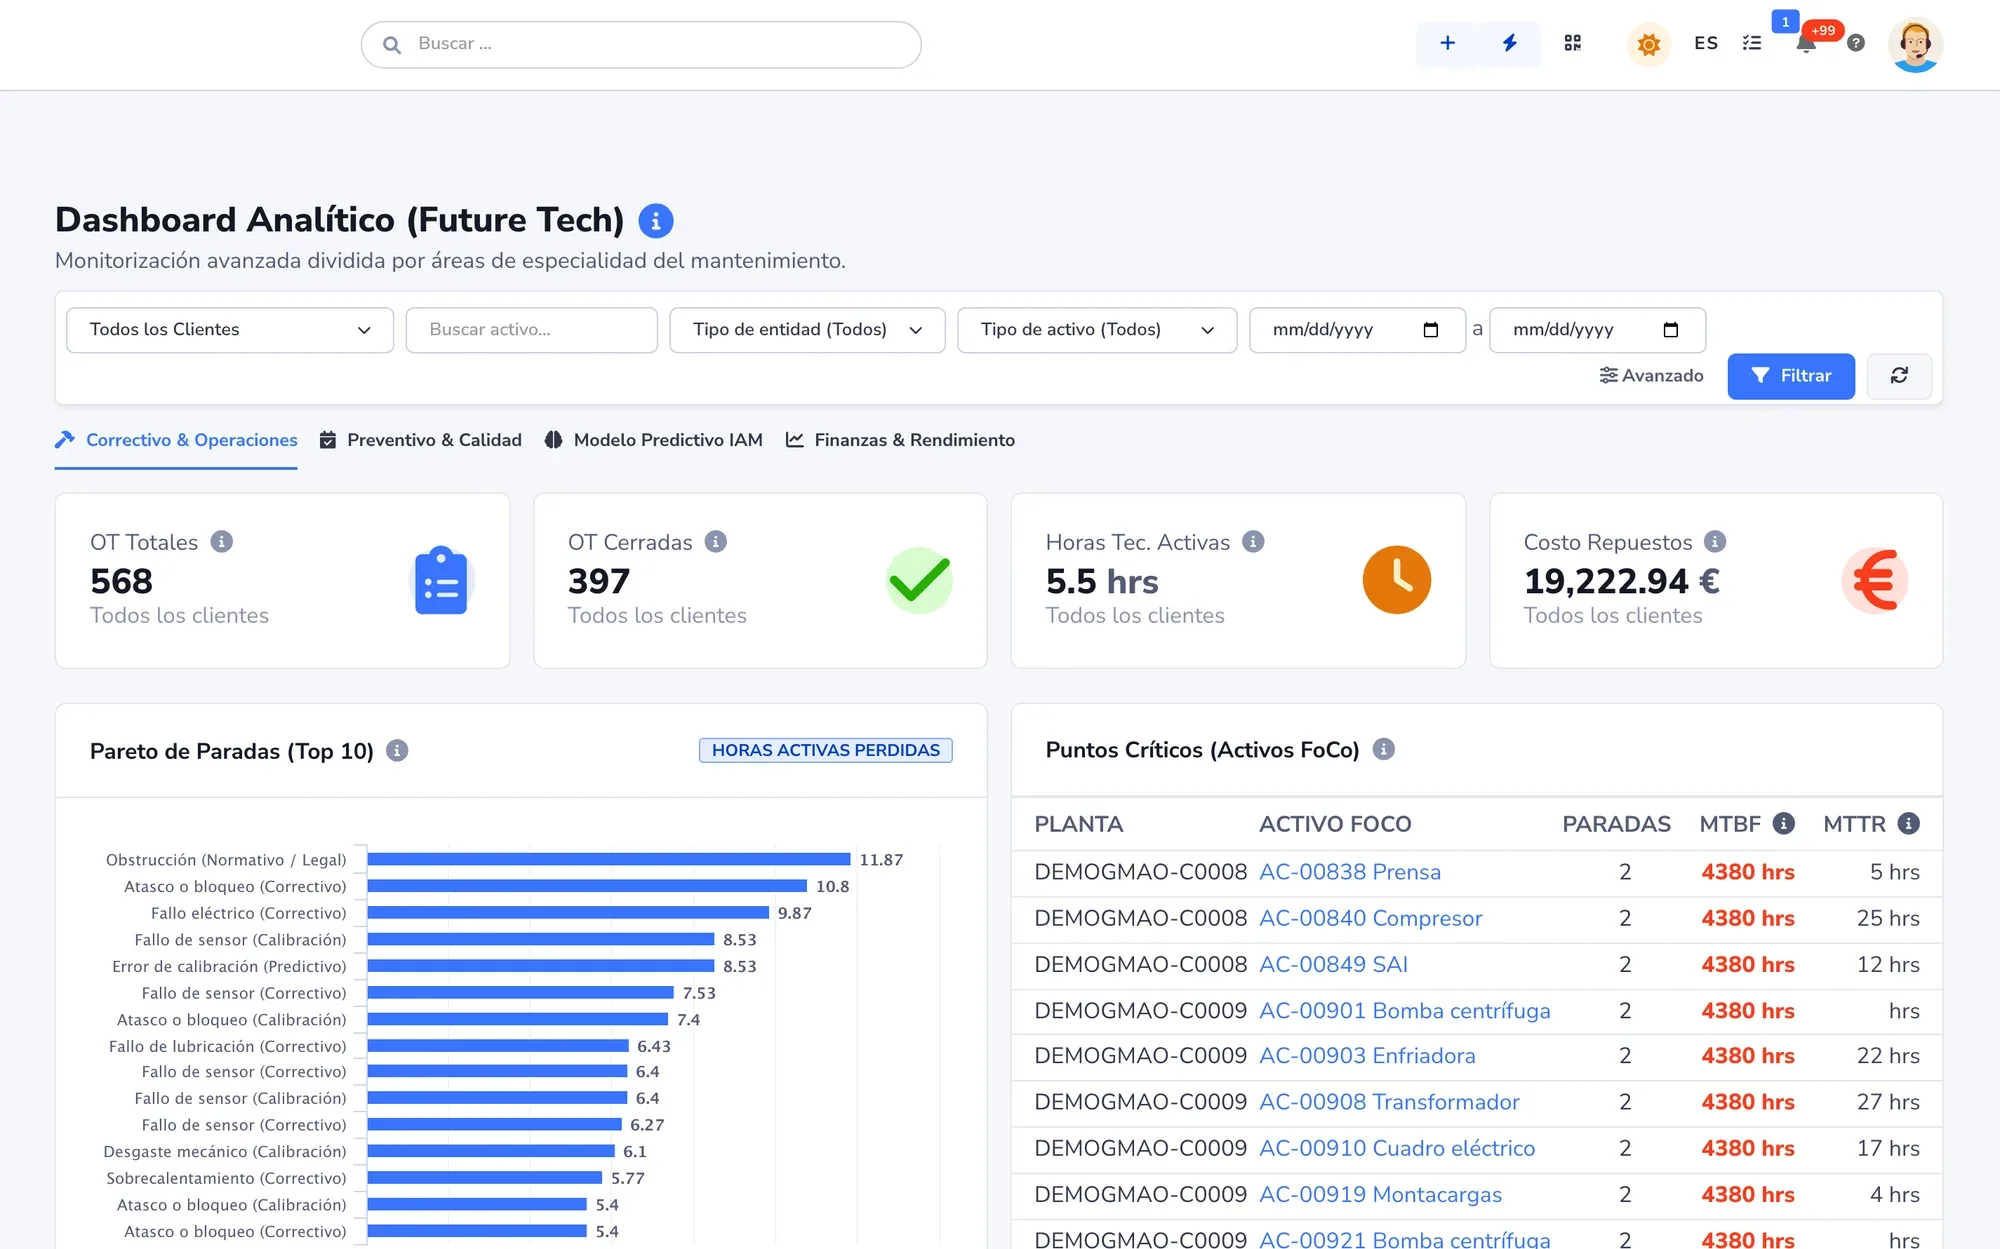
SLA and reopened tickets, agent efficiency, the 22 maintenance KPIs, stock below minimum or won and lost deals. The menu is organized by area and only shows what you subscribe to.
Choose which cookies you accept. You can change this at any time from “Cookie settings” in the footer of every page. Cookie policy
They make the website work, remember this choice, keep your conversation with the assistant if you use it, and protect the forms from bots. They cannot be turned off.
During your visit we remember the campaign source you arrived with and the page you landed on, so we know which campaigns and pages bring us requests. Cloudflare Web Analytics counts visits without cookies and does not depend on this option.
Used to measure our campaigns on Google Ads, LinkedIn and Meta. None is active on the website today.
Reports and dashboards
Reports and dashboards read the same documents your team works on. No one builds a spreadsheet at the end of the month, and each person only sees the data that concerns them.
SELECT supplier, COUNT(*) … GROUP BY supplier Data and integrations
SLA and reopened tickets, agent efficiency, the 22 maintenance KPIs, stock below minimum or won and lost deals. The menu is organized by area and only shows what you subscribe to.
CMMS, Ticketing, CRM and the rest come with their own, which you edit, turn off or restore to factory settings. And you build your own, with traffic-light targets. Every query has a time limit: none slows the instance down.
The daily report arrives by email for whoever needs it. And you can schedule any other report, weekly for example, without anyone having to prepare it.
If another tool in your company needs the operations data, it reads it through API v4 or MCP. Each key only does what you allow.
You filter by customer, document type, asset or dates. Permissions also apply to reports and downloads: each person only sees what they have been granted, down to the value of a field.
Each area has its home screen with its indicators, and so does each profile. The first thing the technician, the sales rep or management sees is what they need to look at.
How it works
Maintenance, support, sales, stock and hours come with their reports, filters and export.
With your indicators, your filters and your traffic-light targets. Describe it and marIA suggests the chart.
The daily report and any scheduled reports reach whoever needs them.
Another tool reads the data through API v4 or MCP, with each key’s permissions.
In the dashboard builder you describe what you want to see and marIA suggests the visualization. In team reports it writes a plain-language reading, with no figures that are not in the table. For one-off questions about your data there is AI-Chat and DB Assistant. Every operation is logged with its cost, under the monthly cap you set.
Where it is used
Industry solutions
Honesty
It is not a corporate BI tool. If your company already has one, it reads attendo’s data through the API or MCP.
Reports read attendo’s data. Accounting stays in your ERP.
Works with
SELECT supplier, COUNT(*) … GROUP BY supplier Ask in plain language. Get answers from your data, with the source.
See AI-Chat and DB AssistantOdoo, SAP Business One, Business Central and Holded, connected
See ERP integrationConnect whatever is not on the list, with permissions per key
See API v4, webhooks and MCPGlossary
Maintenance
Mean time between failures
MTBF (mean time between failures) is the average time a piece of equipment runs properly between one breakdown and the next. It measures reliability.
Maintenance
Mean time to repair
MTTR (mean time to repair) is the average time it takes to bring equipment back into service after it fails. It measures responsiveness, not reliability.
Maintenance
Asset availability
Availability is the percentage of time an asset is in a condition to operate.
Support and service
Service level agreement
An SLA (service level agreement) is the written commitment, usually part of a contract, on how quickly you will respond to and resolve a customer’s tickets.
Frequently asked questions
No. Each area comes with its reports and its dashboard: SLA, agent efficiency, the 22 maintenance KPIs, stock below minimum or profitability by customer. You build your own whenever you want.
Yes, through API v4 or MCP, with keys that only do what you allow. For day-to-day work, attendo’s dashboards already read the data live.
Yes. The daily report arrives by email, and you can schedule any other report.
No. Permissions also apply to reports and downloads, down to the value of a field.
Yes. The dashboard refreshes on its own and stays open on the screen.
Request a demo
We will show it to you with your own document types and the way you work. If it is not a fit, we will tell you.
Would you rather talk first?